I Built an LLM Metrics Dashboard
# I Built an LLM Metrics Dashboard
I've been providing local LLMs on [Routstr](https://routstr.com) recently, and I realised I had no visibility into how my models were performing (without repeatedly checking logs). How many requests were they handling? What was the success rate? How fast were they responding?
So I built something to solve this. It's an LLM metrics dashboard that gives you real-time insights into your local AI infrastructure. (For those compatible with the [OpenAI API spec](https://platform.openai.com/docs/api-reference/chat/create))
## The Problem
When you're running AI models locally (whether for personal use or serving others), it's not obvious what your usage looks like unless you dig through logs. You don't know:
- How many requests you're handling
- How fast you are responding
- Which models are popular
- If there are bottlenecks or failures
- What your actual usage patterns look like
This makes it impossible to optimize performance or troubleshoot issues effectively. And just enjoy being used :wink:
## The Solution
I built an [LLM metrics proxy](https://github.com/rewolf/llm-metrics-proxy) that sits between your clients and your AI models, collecting detailed metrics on every completion request, specifically the `/chat/completions` API from [the OpenAI spec](https://platform.openai.com/docs/api-reference/chat/create) which is a standard followed by LLM inference servers (eg. vLLM, Ollama).
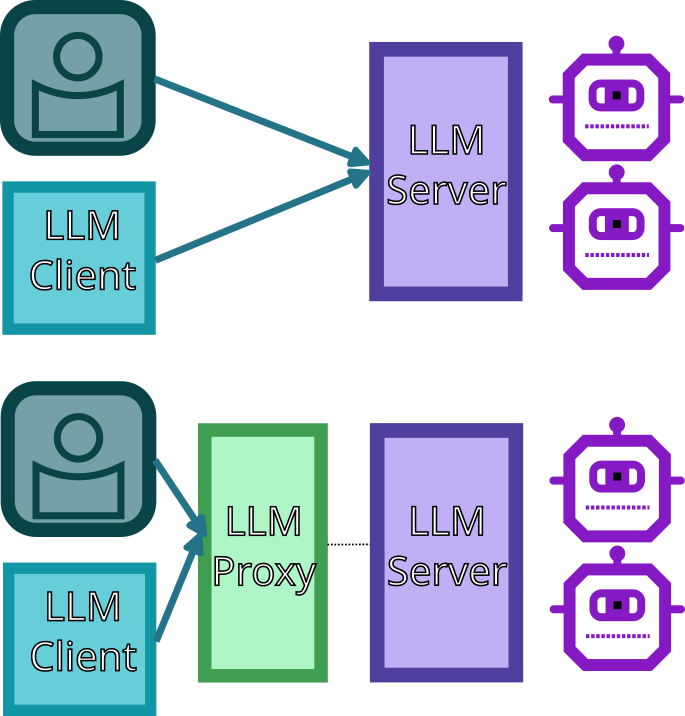
The proxy intercepts all requests, forwards them to your models, and tracks everything:
- Request counts and success rates
- Response times and inference speeds
- Model usage patterns
- Request sources and patterns
## What It Looks Like
The dashboard gives you a clean, real-time view of your AI infrastructure:
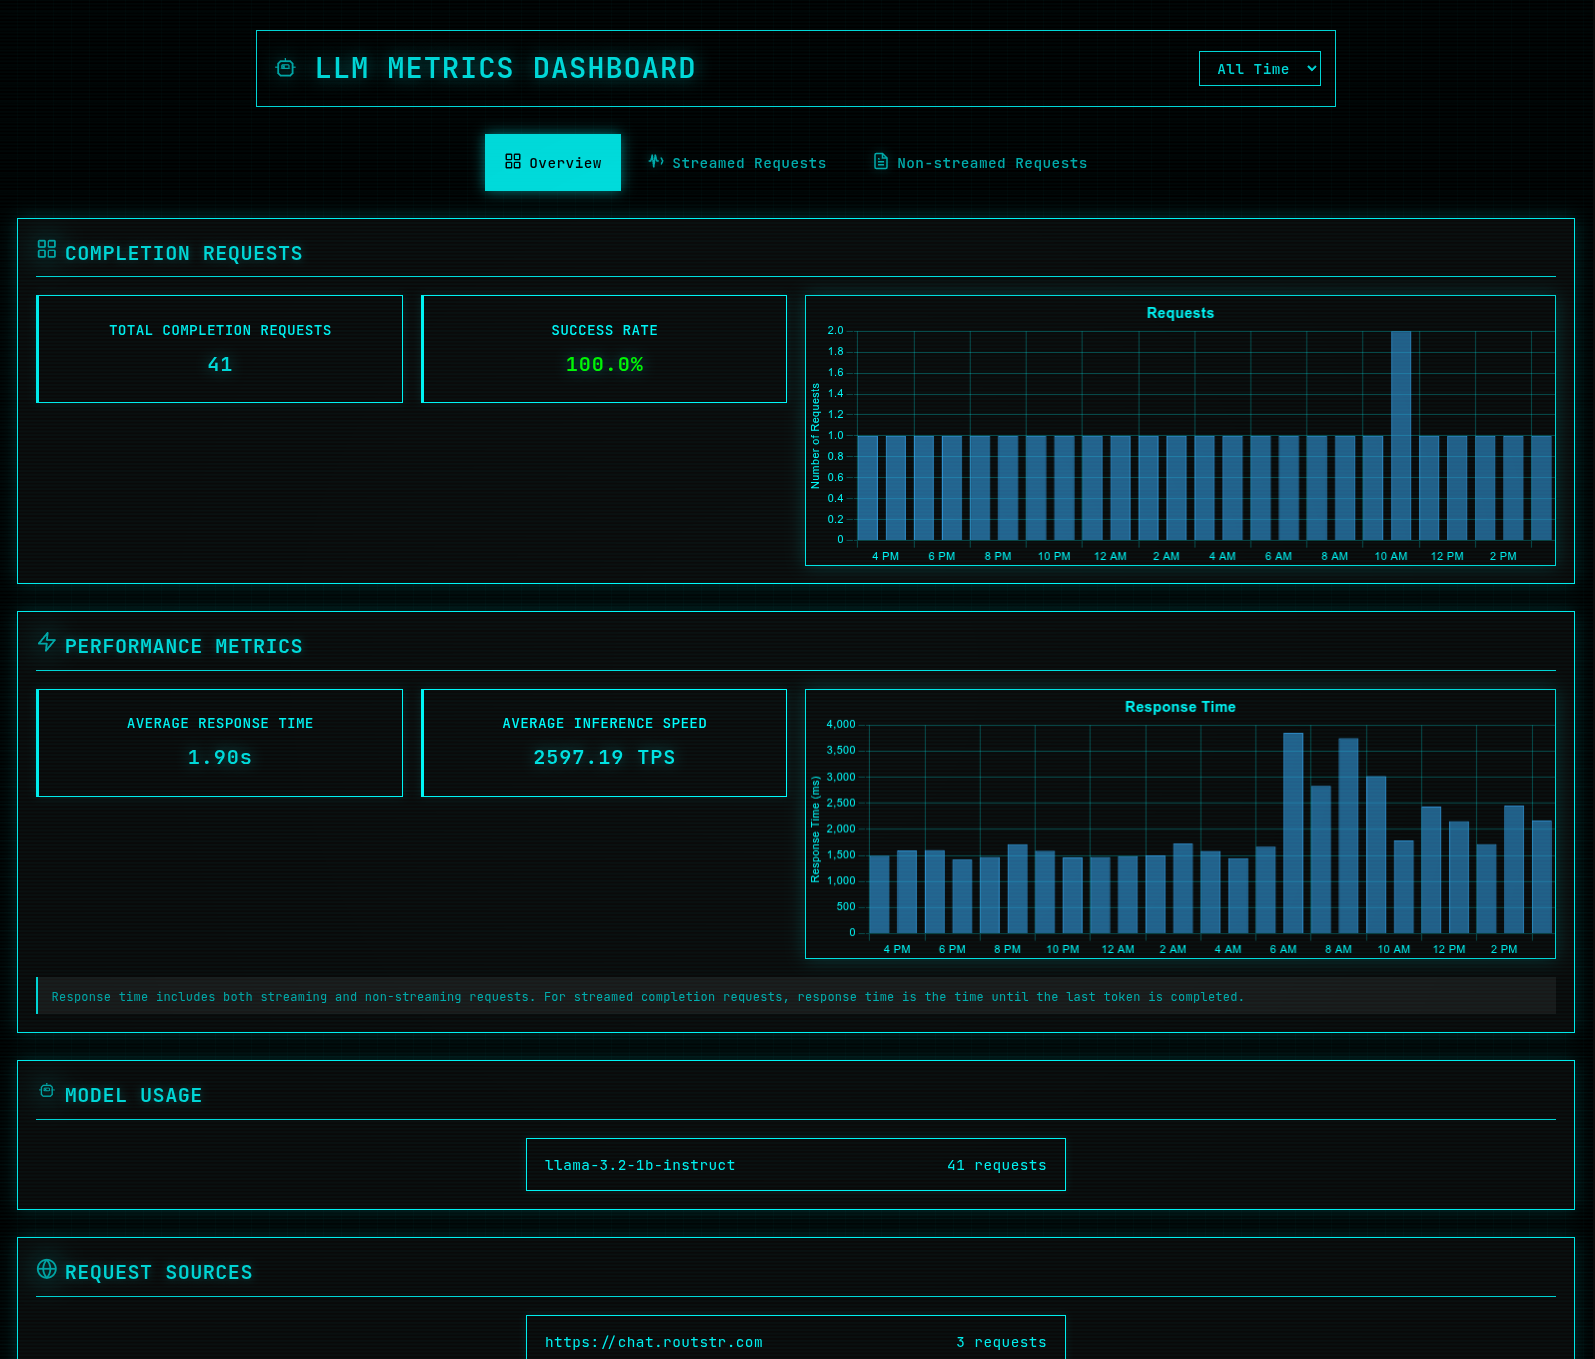
You can see at a glance:
- **Completion Requests**: Total requests and success rates
- **Performance Metrics**: Response times and inference speeds
- **Model Usage**: Which models are being used and how often
- **Request Sources**: Where your traffic is coming from
The frontend seen above is actually optional, you can just get the metrics from the following two APIs (exposed on a different port to the proxy of course):
(see the [API spec](https://github.com/rewolf/llm-metrics-proxy/blob/master/docs/technical/api-spec.md))
**Metrics Endpoint (`/metrics`):**
This endpoint returns aggregated metrics over the requested timeframe (or all time, if not specified)
`start` and `end` parameters can be provided to filter the timeframe.
```json
{
"timestamp": "2024-01-15T10:30:00Z",
"requests": {
"total": {
"total": 150,
"successful": 145,
"failed": 5,
"avg_response_time_ms": 1250.5
},
"streamed": {
"total": 80,
"successful": 78,
"failed": 2,
"avg_response_time_ms": 1500.0
},
"non_streamed": {
"total": 70,
"successful": 67,
"failed": 3,
"avg_response_time_ms": 1000.0
}
},
"model_distribution": {
"llama3.1:8b": 100,
"gpt-4": 30,
"gpt-3.5-turbo": 20
}
}
```
**Completion Requests Endpoint (`/completion_requests`):**
This endpoint returns metric data for each chat completion over the requested timeframe (or all time, if not specified)
`start` and `end` parameters can be provided to filter the timeframe.
The array below contains just a single entry for the example
```json
[
{
"timestamp": "2024-01-15T10:30:00Z",
"is_streaming": true,
"success": true,
"error_type": null,
"timing": {
"time_to_first_token_ms": 150,
"time_to_last_token_ms": 2500,
"response_time_ms": 2500
},
"tokens": {
"total": 150,
"prompt": 100,
"completion": 50
},
"model": "llama3.1:8b",
"origin": "custom-client"
}
]
```
## Why This Matters
### For Personal Use
If you're running models locally for yourself, you can:
- Identify which models perform best for your use cases
- Spot performance degradation before it becomes a problem
- Optimize your hardware setup based on actual usage
### For Serving Others
If you're providing AI services to others, you can:
- Monitor service health and uptime
- Track usage patterns to plan capacity
- Identify and fix performance bottlenecks
- Provide transparency to your users
### For Development
When building AI applications, you can:
- Debug performance issues more effectively
- A/B test different models or configurations
- Validate that your optimizations actually work
## How It Works
The system is surprisingly simple:
1. **Proxy Layer**: A lightweight service that intercepts OpenAI-compatible API calls
2. **Metrics Collection**: Tracks request/response data, timing, and success rates
3. **Database Storage**: SQLite database for persistent metrics storage
4. **Dashboard**: React frontend that visualizes the data in real-time
The proxy is completely transparent to your clients - they just use the same OpenAI-compatible API they're already familiar with.
## Getting Started
The setup is straightforward:
```bash
# Clone the repository
git clone <your-repo>
cd llm-metrics-proxy
# Start the services
docker-compose up -d
# Access the dashboard
open http://localhost:3000
```
The above is just an example that runs its own Ollama server.
**Important Port Configuration:**
- If you're running your LLM server on port 8000, you'll need to change it to something else (like 8010)
- Then you will start the proxy to listen on that port instead so that it receives the requests instead.
- Set the `UPSTREAM_BASE_URL` environment variable to point to your backend server (e.g., `http://localhost:8010`)
Your existing AI clients can now point to the proxy instead of directly to your models, and you'll start getting metrics immediately.
For more detailed examples and use cases, check out the [EXAMPLES.md](https://github.com/rewolf/llm-metrics-proxy/blob/master/EXAMPLES.md) file in the repository.
## What's Next
I have a day job and other commitments, so I'm not sure when or what I'll add going forward. However, the code is open source and contributions are welcome.
There might be other products like this out there, but it was fun to make and I hope others might find it useful. Running AI locally is great, but having proper visibility into your usage makes all the difference.